Fibonacci Retracement: A Guide to Identifying Key Levels
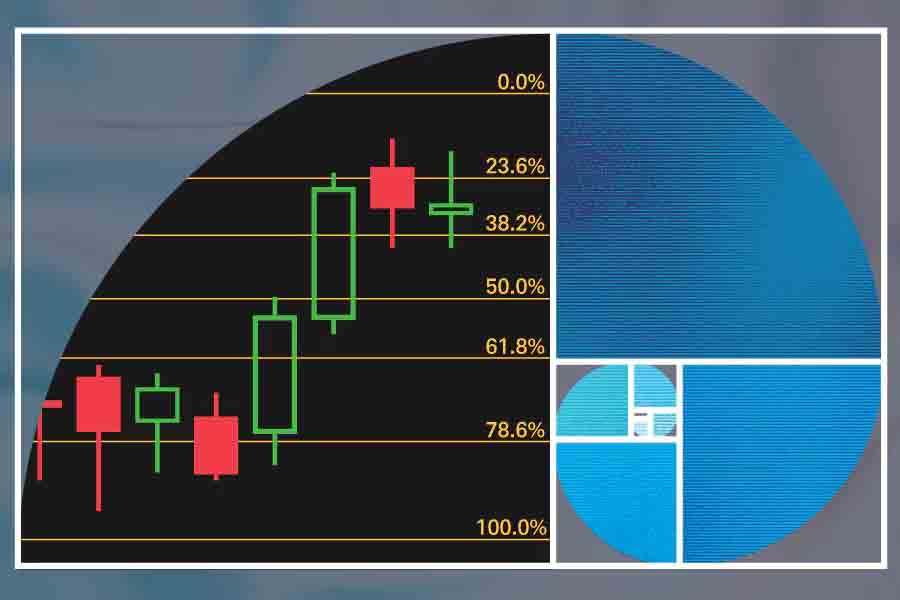
Fibonacci Retracement: A Guide to Identifying Key Levels Fibonacci retracement is a popular technical analysis tool used by traders to identify potential support and resistance levels based on the Fibonacci sequence. Named after the Italian mathematician Leonardo Fibonacci, this tool leverages specific ratios derived from the Fibonacci sequence to predict possible price reversals or continuation […]
Support and Resistance Levels: Role Reversal
Support and Resistance Levels: Role Reversal The concept of role reversal is one of the most significant principles in technical analysis, particularly when dealing with support and resistance levels. It describes the phenomenon where a broken support level transforms into a new resistance level, and a broken resistance level becomes a new support level. This […]
Support and Resistance Levels: Identifying Key Levels

Support and Resistance Levels: Identifying Key Levels Support and resistance levels are essential elements of technical analysis that help traders and investors pinpoint areas on a price chart where the market has historically shown a tendency to reverse or consolidate. These levels represent zones where buying and selling pressure balance out, leading to a pause […]
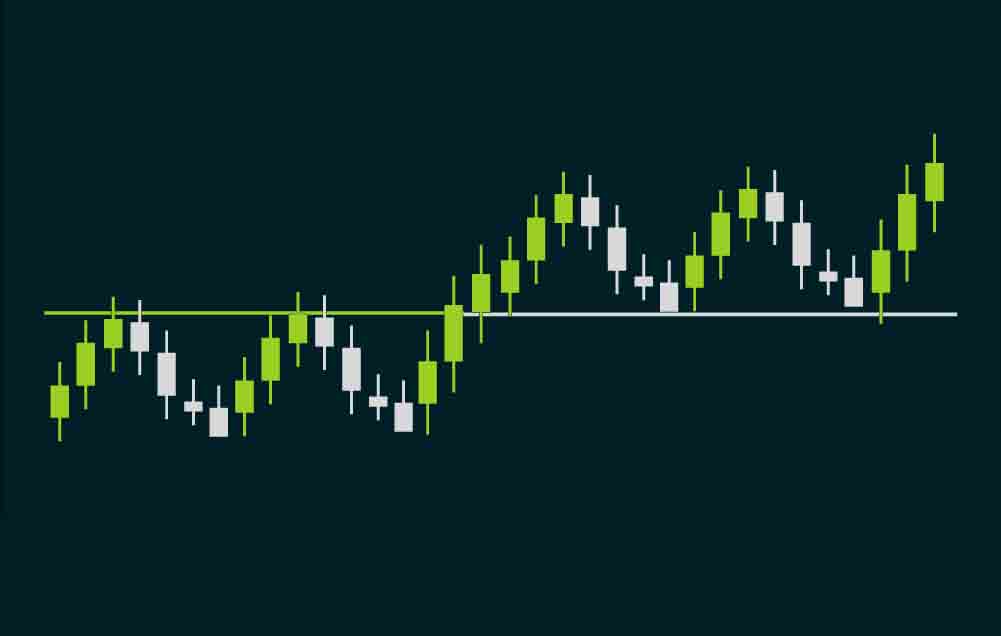
Support and Resistance Levels: Understanding Key Price Zones

Support and Resistance Levels: Understanding Key Price Zones Support and resistance levels are fundamental concepts in technical analysis that help traders identify potential turning points in the market. They are horizontal lines or zones drawn on a chart to represent levels where the price has historically struggled to move above (resistance) or below (support). These […]
Volume Analysis: Importance of Volume in Confirming Trends

Volume Analysis: Importance of Volume in Confirming Trends Volume is a crucial technical indicator used to confirm the validity of trends and the strength of price movements. It provides insights into the level of participation, market sentiment, and the sustainability of trends. When analyzed in conjunction with price action, volume can help traders and investors […]
Key Technical Indicators: Bollinger Bands
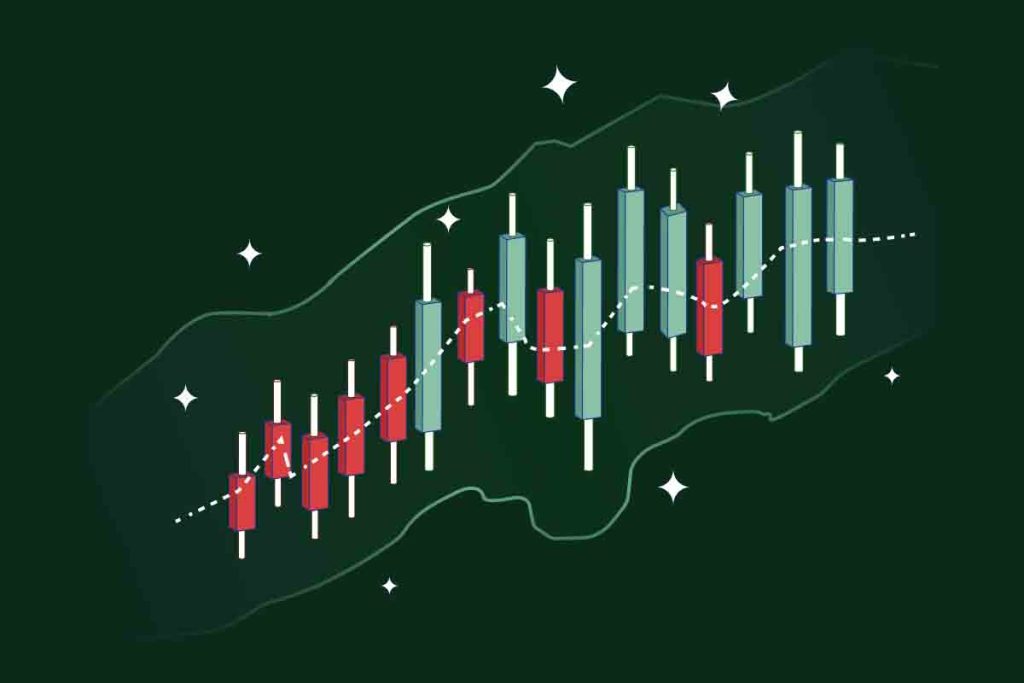
Key Technical Indicators: Bollinger Bands Bollinger Bands are one of the most popular and versatile technical indicators used by traders and analysts to measure market volatility and identify potential trading opportunities. Developed by John Bollinger in the 1980s, Bollinger Bands consist of three lines: the upper band, the lower band, and the middle band, which […]
Volume Analysis

Volume Analysis Volume is one of the most fundamental and powerful technical indicators used in financial markets. It measures the number of shares or contracts traded in a given period and provides essential insights into the strength and sustainability of price movements. Volume analysis is a critical tool for traders and investors, helping them confirm […]
Key Technical Indicators: Moving Average Convergence Divergence (MACD)
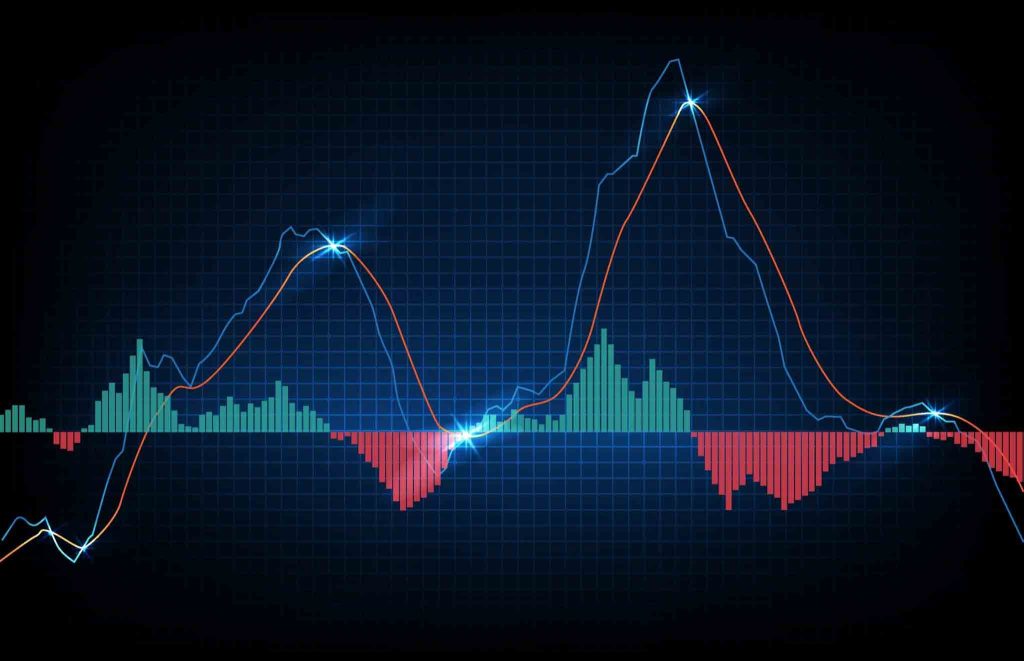
The Moving Average Convergence Divergence (MACD) is one of the most widely used technical indicators among traders and analysts. Developed by Gerald Appel in the late 1970s, the MACD helps identify changes in the strength, direction, momentum, and duration of a trend in a stock’s price. It achieves this by measuring the relationship between two […]
Key Technical Indicators: Relative Strength Index (RSI)
Key Technical Indicators: Relative Strength Index (RSI) The Relative Strength Index (RSI) is a momentum oscillator used in technical analysis to measure the speed and change of price movements. Developed by J. Welles Wilder in 1978, the RSI helps traders identify overbought and oversold conditions in a market, spot potential reversals, and gauge the strength […]
Key Technical Indicators: Moving Averages (SMA, EMA)
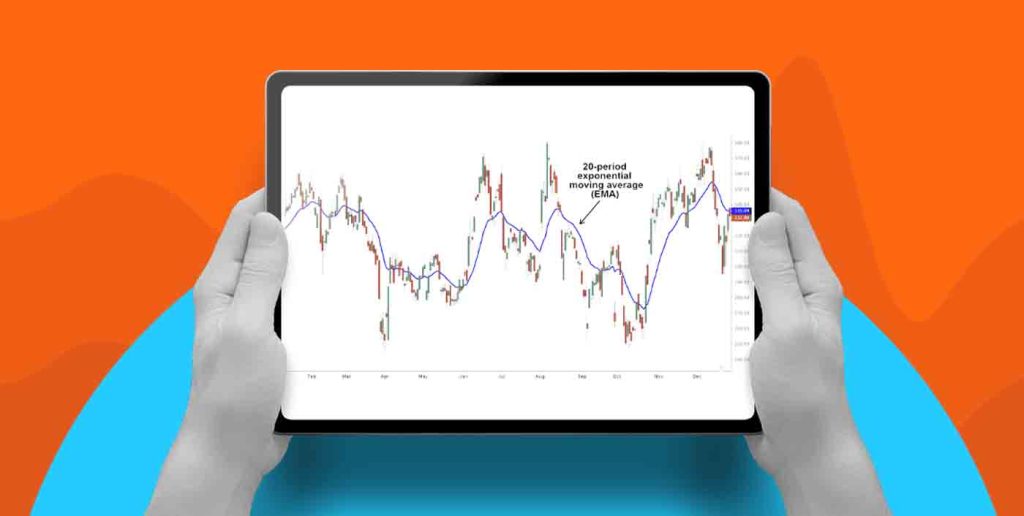
Key Technical Indicators: Moving Averages (SMA, EMA) Moving averages are one of the most widely used technical indicators in financial markets. They smooth out price data to create a single flowing line that helps traders and investors identify the overall trend of an asset. There are different types of moving averages, with the Simple Moving […]