Key Technical Indicators: Relative Strength Index (RSI)
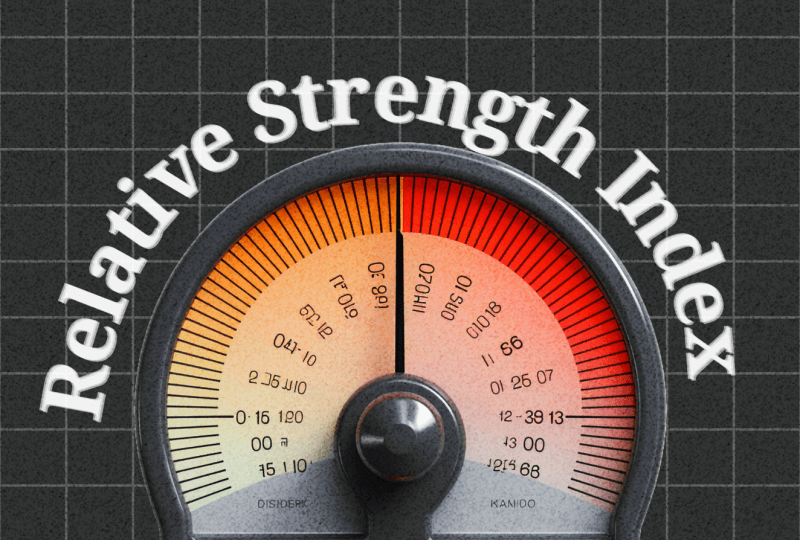
Key Technical Indicators: Relative Strength Index (RSI) The Relative Strength Index (RSI) is a momentum oscillator used in technical analysis to measure the speed and change of price movements. Developed by J. Welles Wilder in 1978, the RSI helps traders identify overbought and oversold conditions in a market, spot potential reversals, and gauge the strength […]
Key Technical Indicators: Moving Averages (SMA, EMA)
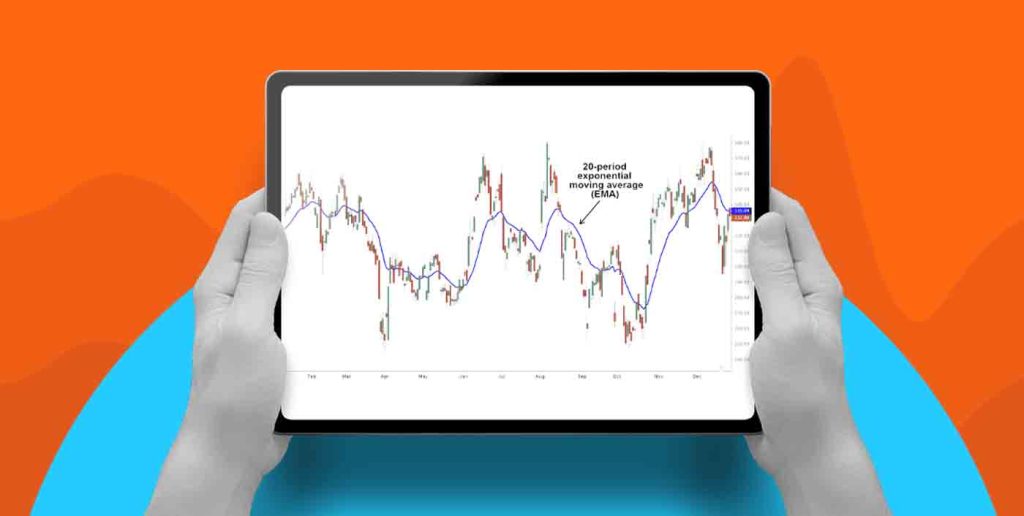
Key Technical Indicators: Moving Averages (SMA, EMA) Moving averages are one of the most widely used technical indicators in financial markets. They smooth out price data to create a single flowing line that helps traders and investors identify the overall trend of an asset. There are different types of moving averages, with the Simple Moving […]
Technical Analysis

Technical analysis is a method used to evaluate and predict the future price movements of financial assets such as stocks, forex, and commodities based on historical price data and trading volumes. Unlike fundamental analysis, which focuses on the intrinsic value of an asset by analyzing financial statements and economic indicators, technical analysis relies solely on […]