Fibonacci Retracement and Extension: Practical Applications in Trading
Fibonacci Retracement and Extension tools are widely utilized by traders to identify key levels where price reversals, consolidations, or continuations are likely to occur. While Fibonacci Retracement helps identify potential reversal levels during pullbacks, Fibonacci Extension projects possible price targets when the trend continues. Understanding these tools and applying them effectively can significantly enhance a trader’s market analysis and decision-making. This article explores the practical applications of Fibonacci Retracement and Extension in various trading scenarios, offering strategies that can be applied across different asset classes and timeframes.
Understanding Fibonacci Retracement
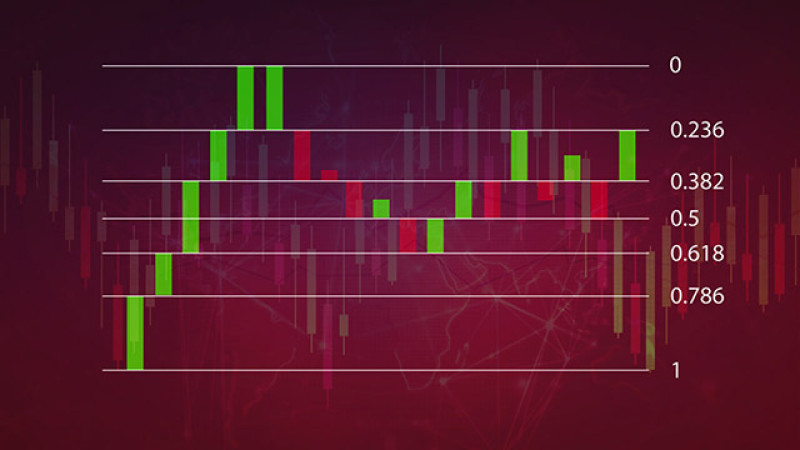
Fibonacci Retracement levels are horizontal lines that indicate where support and resistance are likely to occur. These levels are derived from the Fibonacci sequence and include key percentages such as 23.6%, 38.2%, 50%, 61.8%, and 78.6%. They represent the potential retracement of a move before the price resumes in its original direction.
How to Draw Fibonacci Retracement:
- Identify the Trend: Determine whether the market is trending up or down. Fibonacci Retracement is most effective in trending markets.
- Select the Swing High and Swing Low: For an uptrend, draw the retracement from the swing low (starting point) to the swing high (ending point). For a downtrend, draw it from the swing high to the swing low.
- Interpret the Levels: The retracement levels will automatically appear between the two points. These levels act as potential support or resistance, indicating areas where the price may pull back before continuing its trend.
Practical Application of Fibonacci Retracement
- Identifying Entry Points During a Pullback: In a bullish trend, traders often look for the price to pull back to key Fibonacci levels (e.g., 38.2% or 61.8%) before entering a long position. The idea is to buy at a lower price within an uptrend, increasing the potential reward-to-risk ratio.
- Example: If the price of a stock rises from $50 to $100 and then pulls back to $75 (a 50% retracement), it might present a buying opportunity, assuming the overall trend remains intact.
- Setting Stop-Loss Levels: Fibonacci Retracement levels can also be used to determine stop-loss placements. Traders typically set their stop-loss orders slightly below the 61.8% or 78.6% retracement level in an uptrend, expecting the price to bounce from these levels.
- Determining Profit Targets: When using Fibonacci Retracement in combination with Fibonacci Extension, traders can set profit targets at specific extension levels, such as 161.8% or 261.8% of the initial move, once the price resumes its trend.
Understanding Fibonacci Extension
Fibonacci Extension levels go beyond the standard retracement levels and project where the price might go in the future. These levels are crucial for identifying potential profit targets or areas of interest when the price surpasses its previous high or low.
How to Draw Fibonacci Extension:
- Select the Swing Points: Similar to Fibonacci Retracement, you need to choose three points:
- The starting point (A) of the initial price move.
- The end point (B) of the price move.
- The retracement level (C) where the price temporarily reverses.
- Apply the Extension Tool: Using these three points, the Fibonacci Extension tool will project levels such as 100%, 161.8%, 200%, 261.8%, and 423.6%. These levels indicate where the price is likely to find resistance or support in the direction of the trend.
Practical Application of Fibonacci Extension
- Setting Profit Targets: After identifying a trend and a subsequent retracement, traders use Fibonacci Extension levels to set profit targets. For example, if a trader buys a stock at the 50% retracement level during an uptrend, they may set their take-profit order at the 161.8% or 261.8% extension level.
- Example: If the price moves from $100 to $150 (initial move), retraces to $120, and then resumes its uptrend, the 161.8% extension level would project a future price of approximately $180.
- Analyzing Trend Continuations: Fibonacci Extensions can help traders identify where a strong trend might continue or find resistance. If the price reaches the 100% extension level and shows no signs of reversal, it indicates strong momentum, and traders can aim for the next extension level (161.8%).
- Combining with Other Indicators: Fibonacci Extensions are most effective when used in conjunction with other indicators like Moving Averages, RSI, or MACD. If a 161.8% extension level coincides with a key Moving Average or RSI overbought level, it suggests a potential reversal or consolidation point.
Combining Fibonacci Retracement and Extension for Effective Trading
- Entry and Exit Strategy: A common approach is to enter a trade at a Fibonacci Retracement level (e.g., 50% retracement) and set profit targets using Fibonacci Extension levels (e.g., 161.8%). This strategy helps define a clear risk-to-reward ratio and avoid emotional trading decisions.
- Using Fibonacci Confluence: Look for confluence between Fibonacci Retracement and Extension levels across different timeframes. If a Fibonacci Retracement level on a 4-hour chart aligns with a Fibonacci Extension level on a daily chart, it forms a strong zone of interest, enhancing the likelihood of price action responding to that area.
- Determining Market Structure: Fibonacci levels can reveal the underlying market structure and potential reversal zones. For example, a deep retracement to 78.6% may suggest a potential double bottom or head and shoulders formation, providing additional confirmation for trade entries.
Common Mistakes and How to Avoid Them
- Over-reliance on Fibonacci Levels: Relying solely on Fibonacci levels without considering market context, such as trend direction, volume, or other technical indicators, can lead to false signals. Always use Fibonacci in combination with other analysis techniques.
- Drawing Fibonacci Incorrectly: Ensure that Fibonacci levels are drawn correctly, aligning precisely with the swing high and low points. Misplacing these points can result in misleading levels and inaccurate analysis.
- Ignoring Long-term Trends: Fibonacci tools should be applied in the context of longer-term trends to avoid short-term market noise. Even if a Fibonacci level appears significant on a 15-minute chart, it may not hold if the broader daily trend suggests otherwise.
Conclusion
Fibonacci Retracement and Extension are indispensable tools for traders seeking to identify potential price levels, manage trades effectively, and forecast market movements. When used correctly, these tools offer significant insights into market psychology and price behavior, providing traders with an edge in both trend-following and counter-trend strategies. By integrating these Fibonacci tools with other forms of analysis and maintaining discipline in their application, traders can improve their overall performance and achieve more consistent results.