Common Chart Patterns: Head and Shoulders, Double Tops, and Double Bottoms
Chart patterns are essential tools in technical analysis that help traders identify potential trend reversals and continuations. These patterns form when the price of an asset moves in a specific shape or formation, signaling changes in market sentiment. Two of the most widely used chart patterns are the Head and Shoulders pattern and the Double Tops/Bottoms pattern. Understanding these patterns and how to trade them can significantly improve your trading strategy.
1. Head and Shoulders Pattern
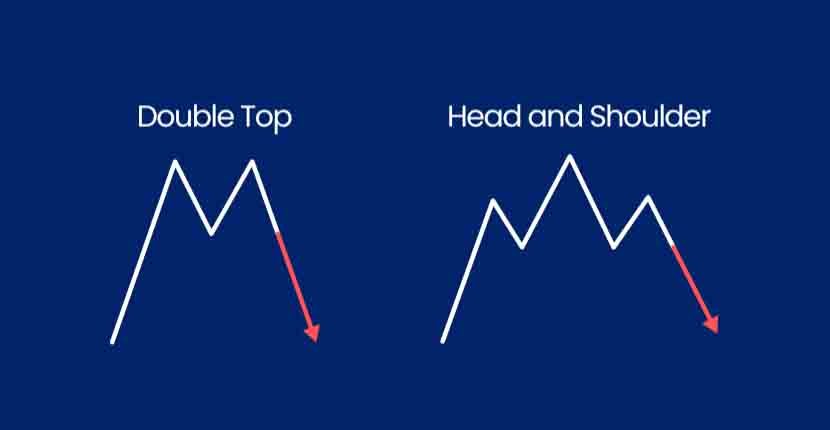
The Head and Shoulders pattern is a reversal pattern that indicates a potential trend reversal from bullish to bearish or vice versa. It is named after its appearance, which resembles a head (the middle peak or trough) with two shoulders (the lower peaks or troughs on either side).
Types of Head and Shoulders Patterns:
- Standard (Top) Head and Shoulders: This pattern forms after an uptrend and indicates a potential bearish reversal. It consists of three peaks:
- The left shoulder forms after a price increase and a subsequent decline.
- The head forms when the price rises above the left shoulder but then declines again.
- The right shoulder forms when the price rises again but does not exceed the head’s peak, followed by another decline.
- Inverse (Bottom) Head and Shoulders: This pattern forms after a downtrend and indicates a potential bullish reversal. It is the mirror image of the standard Head and Shoulders pattern, with the head and shoulders forming as troughs rather than peaks.
How to Identify a Head and Shoulders Pattern:
- Left Shoulder: The first peak forms, followed by a price decline.
- Head: The second peak forms, higher than the left shoulder, followed by another decline.
- Right Shoulder: The third peak forms, lower than the head, and the price declines again.
- Neckline: Draw a trendline connecting the lows of the left and right shoulders (for a top pattern) or the highs (for a bottom pattern). This line serves as the breakout level.
How to Trade the Head and Shoulders Pattern:
- Entry Point: Enter a trade when the price breaks below (in the case of a top pattern) or above (in the case of a bottom pattern) the neckline. The breakout confirms the pattern.
- Price Target: Measure the distance between the head and the neckline and project it from the breakout point to determine the price target.
- Stop Loss: Place a stop loss above the right shoulder for a top pattern or below the right shoulder for a bottom pattern to minimize risk.


2. Double Top Pattern
The Double Top pattern is a bearish reversal pattern that forms after an uptrend. It indicates that the asset has reached a resistance level twice and is unable to break through, suggesting a potential trend reversal to the downside.
Characteristics of a Double Top Pattern:
- Two Peaks: The pattern consists of two peaks at approximately the same price level, separated by a trough.
- Resistance Level: The two peaks form near a resistance level, where selling pressure prevents further upward movement.
- Neckline Support: The trough between the two peaks creates a support level (neckline).
How to Trade the Double Top Pattern:
- Entry Point: Enter a trade when the price breaks below the neckline support level after forming the second peak.
- Price Target: Measure the height of the pattern (distance between the peaks and the neckline) and project it downward from the breakout point to set a price target.
- Stop Loss: Place a stop loss above the second peak to manage risk in case of a false breakout.

3. Double Bottom Pattern
The Double Bottom pattern is a bullish reversal pattern that forms after a downtrend. It indicates that the asset has reached a support level twice and is unable to break below, suggesting a potential trend reversal to the upside.
Characteristics of a Double Bottom Pattern:
- Two Troughs: The pattern consists of two troughs at approximately the same price level, separated by a peak.
- Support Level: The two troughs form near a support level, where buying pressure prevents further downward movement.
- Neckline Resistance: The peak between the two troughs creates a resistance level (neckline).
How to Trade the Double Bottom Pattern:
- Entry Point: Enter a trade when the price breaks above the neckline resistance level after forming the second trough.
- Price Target: Measure the height of the pattern (distance between the troughs and the neckline) and project it upward from the breakout point to set a price target.
- Stop Loss: Place a stop loss below the second trough to protect against potential losses in case of a false breakout.

Differences Between Head and Shoulders and Double Tops/Bottoms
| Pattern | Formation | Signal | Entry Point | Price Target |
|---|---|---|---|---|
| Head and Shoulders | Three peaks or troughs (left shoulder, head, right shoulder) | Bullish or bearish reversal | Breakout above/below neckline | Distance between head and neckline |
| Double Tops/Bottoms | Two peaks (Double Top) or two troughs (Double Bottom) | Bearish or bullish reversal | Breakout below/above neckline | Height of the pattern (peak to neckline distance) |
Example of Trading Head and Shoulders and Double Tops/Bottoms
- Head and Shoulders Example:
- Imagine the price of a stock forms a Head and Shoulders pattern after an uptrend.
- The neckline is drawn connecting the lows of the left and right shoulders.
- When the price breaks below the neckline, a short position can be initiated, with a stop loss above the right shoulder and a target equal to the height of the head projected downward.
- Double Top Example:
- Assume the price of a currency pair forms a Double Top pattern near a resistance level.
- After forming the second peak and breaking below the neckline, a short position can be initiated, with a stop loss above the second peak and a target equal to the height of the pattern projected downward.
Limitations of Using Chart Patterns
- False Breakouts: Not all breakouts lead to successful trades; prices may reverse back, resulting in false signals.
- Subjectivity: Identifying chart patterns can be subjective, and different traders may interpret the same pattern differently.
- Lagging Indicators: Chart patterns are formed using historical price data and may lag behind current market conditions.
Conclusion
Head and Shoulders and Double Tops/Bottoms are powerful reversal patterns that, when identified correctly, can provide valuable insights into potential trend reversals. By understanding the structure of these patterns and applying effective entry and exit strategies, traders can capitalize on market reversals and enhance their trading performance. However, it is essential to use these patterns in conjunction with other technical indicators and risk management strategies to confirm signals and minimize risks.